

2023 Soybean Microbial Product Trials
go.ncsu.edu/readext?978658
en Español / em Português
El inglés es el idioma de control de esta página. En la medida en que haya algún conflicto entre la traducción al inglés y la traducción, el inglés prevalece.
Al hacer clic en el enlace de traducción se activa un servicio de traducción gratuito para convertir la página al español. Al igual que con cualquier traducción por Internet, la conversión no es sensible al contexto y puede que no traduzca el texto en su significado original. NC State Extension no garantiza la exactitud del texto traducido. Por favor, tenga en cuenta que algunas aplicaciones y/o servicios pueden no funcionar como se espera cuando se traducen.
Português
Inglês é o idioma de controle desta página. Na medida que haja algum conflito entre o texto original em Inglês e a tradução, o Inglês prevalece.
Ao clicar no link de tradução, um serviço gratuito de tradução será ativado para converter a página para o Português. Como em qualquer tradução pela internet, a conversão não é sensivel ao contexto e pode não ocorrer a tradução para o significado orginal. O serviço de Extensão da Carolina do Norte (NC State Extension) não garante a exatidão do texto traduzido. Por favor, observe que algumas funções ou serviços podem não funcionar como esperado após a tradução.
English
English is the controlling language of this page. To the extent there is any conflict between the English text and the translation, English controls.
Clicking on the translation link activates a free translation service to convert the page to Spanish. As with any Internet translation, the conversion is not context-sensitive and may not translate the text to its original meaning. NC State Extension does not guarantee the accuracy of the translated text. Please note that some applications and/or services may not function as expected when translated.
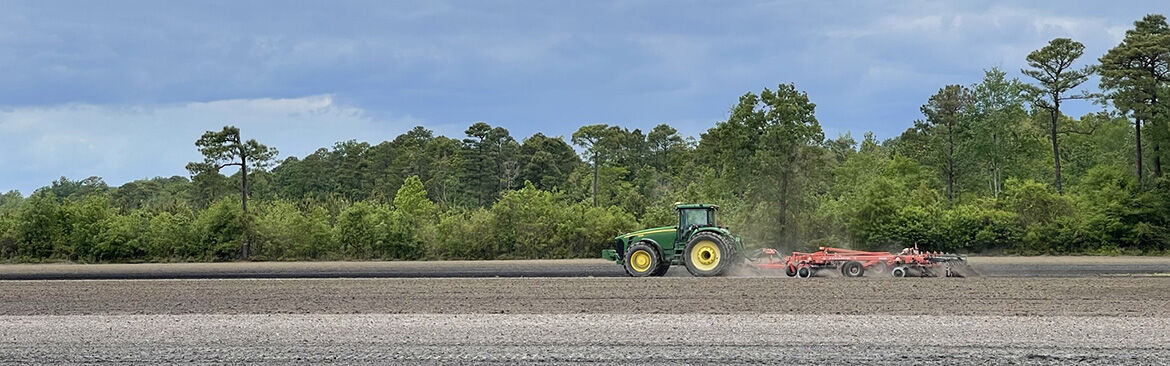
Collapse ▲The NC State Soil Microbiome Extension program conducted microbial product field trials across North Carolina in 2023. Microbial inoculants are a type of biostimulant comprised of living microbes – bacteria and fungi. Microbial biostimulants can improve plant growth through mechanisms like increased plant nutrient access or enhanced plant stress tolerance. The objective of this study was to evaluate field efficacy of microbial seed treatments on soybean production across North Carolina’s regional environments.
Study Design
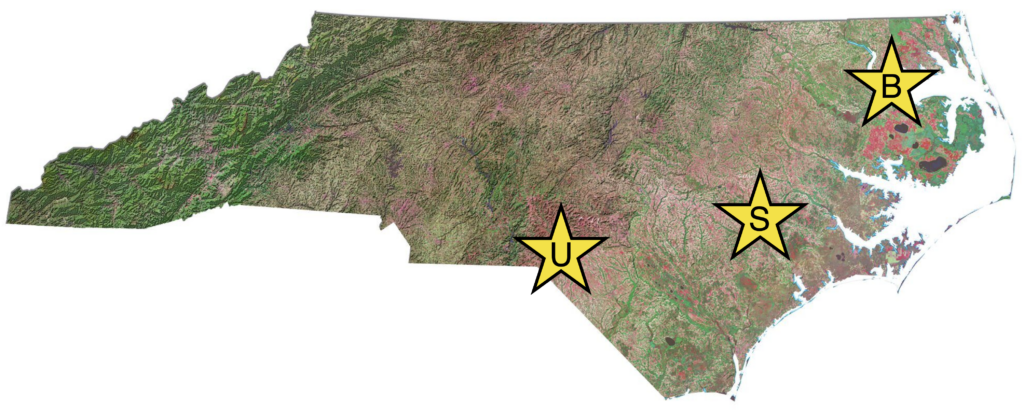
Trials were installed at OVT locations in Beaufort County (Tidewater), Sampson County (Coastal Plains), and Union County (Piedmont). See Supplementary Table 1 for soil characteristics and cultural practices and Supplementary Figure 1 for 2023 weather data.
Three microbial seed treatments (Table 1) plus a non-treated control were installed at each location in a randomized plot design (4 x 20 ft rows with 15” row spaces) with 4 replicates per treatment. Product application rates followed manufacturer’s instructions, with a total application volume of 5 fluid oz/100 lbs of seed (volume adjusted with DI water). Seeds were planted within 5 days of treatment. We treated two soybeans varieties: Asgrow Bayer Crop Sciences AG52XF0 (MG 5.2) and AG59XF0 (MG 6.1) which are XF/SR (trait) and pre-treated with Acceleron Fungicide and Insecticide.
Table 1. Microbial seed treatment label information. *Microbial species are bacterial unless indicated as fungal (F). **Stabilize RZ is recommended as a soil amendment/in-furrow application, and the seed application in this study is exploratory. cfu = colony-forming units, vp = viable propagules
| Product | Company | Formulation* | Storage | Application Rate |
| EndoShield ST | JABB of the Carolinas | 1% Beauveria bassianaF (min 1×10⁸ cfu/ml), 99% adjuvant | Store below 90 ˚F out of direct sunlight | 1 fl. oz per 100 lbs seed |
| Vault IP Plus | BASF Corporation | Component A: 3.132% Bacillus amyloliquefaciens MBl600 (1.4×10¹⁰ CFU/ml), 1.706% Bacillus subtilis strain BU1814 (1.4×10⁹ cfu/ml), 50-60% glycerol; Component B: 100% Bradyrhizobium japonicum (1.0×10¹⁰ cfu/ml) | Store at 35-86 ˚F, keep away from heat and direct sunlight | 0.1 fl. oz Component A and 1 fl. oz Component B per 100 lbs seed |
| Stabilize RZ | Coastal Agrobusiness | <1% Brevibacillus spp. and Bacillus spp. (2.5×10⁹ cfu/ml); Glomus spp.F (48 vp/ml) | Room temperature | 1 pint/acre as soil amendment; 2.5 fl. oz per 100 lbs seed for this study** |
Results
Soybean yield differs significantly (P<0.001) between locations (Beaufort=67 bu/acre, Sampson=90.5 bu/acre and Union 73.3 bu/acre on average) (Figure 1, Table 2). Within each location, yield differs significantly (P<0.03) between maturity groups (Figure 2). Yield does not differ between microbial seed treatments. There are no significant differences in yield between microbial treatments and non-treated controls within each location and maturity group.
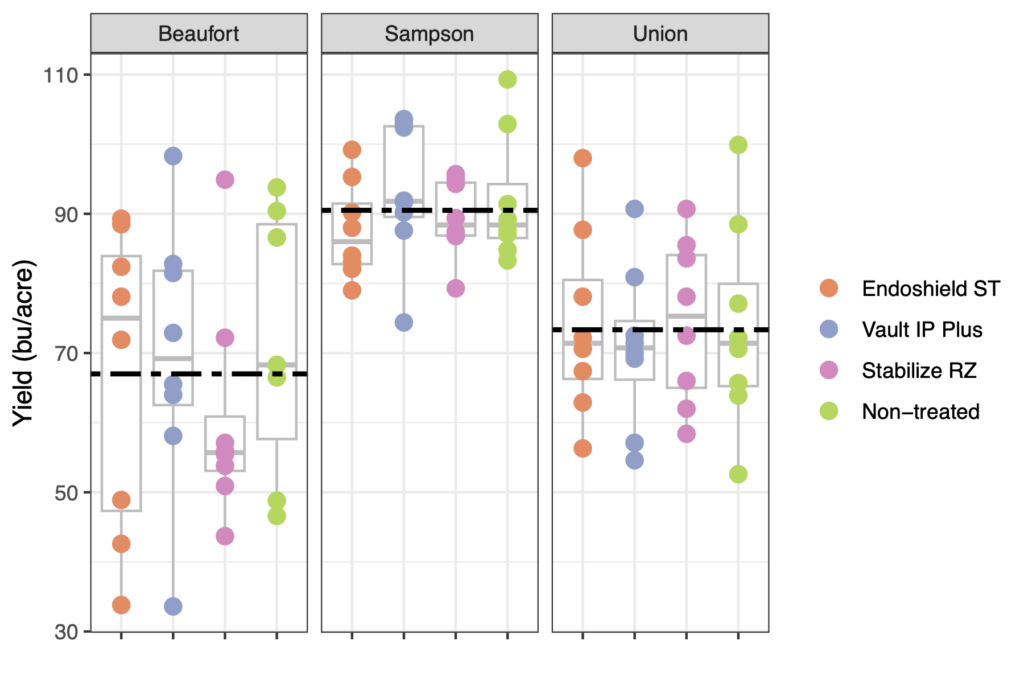
Figure 1. Colored dots show soybean yield (bu/acre) by location for all microbial seed treatments plus non-treated controls. Box plots show the distribution and median yield (gray line) for each treatment. Black dashed lines show the average yield per location and variety/maturity group.
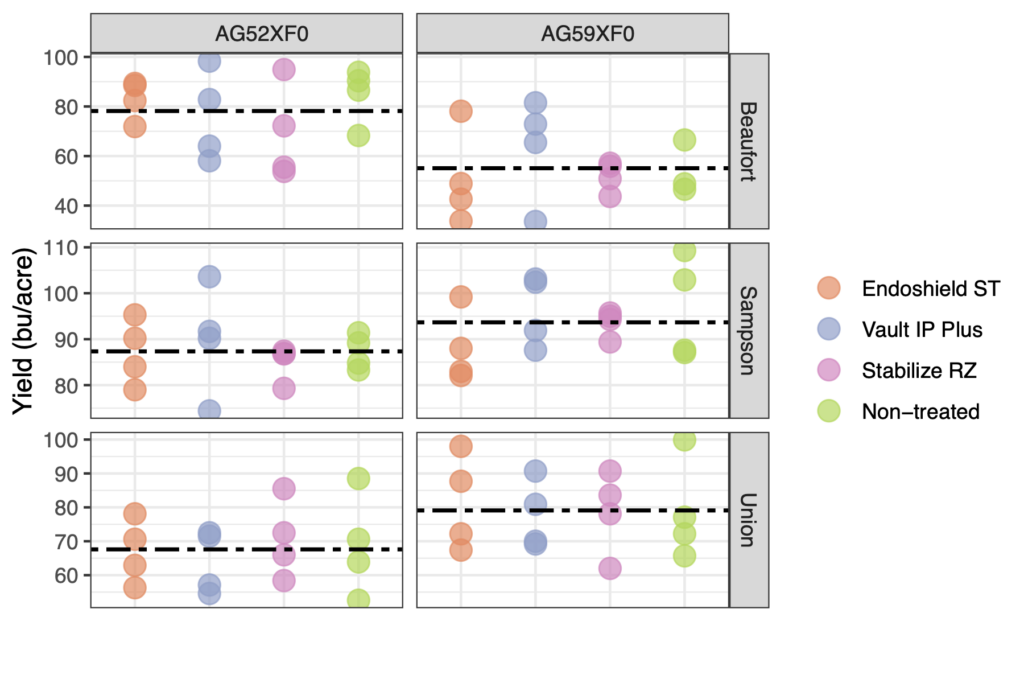
Figure 2. Colored dots show soybean yield (bu/acre) by location and variety/maturity group for all microbial seed treatments plus non-treated controls. Black dashed lines show the average yield per location and variety/maturity group.
Table 2. Soybean yield (bu/acre) per location averaged across 4 plot replicates for varieties AG52XF0 (MG5.2)/AG59XF0 (MG 6.1). NA was due to combine error.
| Microbial Treatment | Beaufort | Sampson | Union |
| EndoShield ST | 83.0/50.9 | 87.1/88.1 | 67.0/81.3 |
| Vault IP Plus | 75.8/63.4 | 90.0/96.3 | 63.9/77.7 |
| Stabilize RZ | 69.1/51.9 | 85.1/93.6 | 70.6/78.6 |
| Non-treated | 84.8/NA | 87.2/96.7 | 68.9/78.7 |
Leaf macronutrients at early growth stage (V4-V5) differed between Beaufort and Sampson locations for nitrogen (P<0.001) and phosphorus (P=0.065) but not potassium (Figure 3, Table 3). Leaf nutrients did not differ between maturity group or microbial treatment.
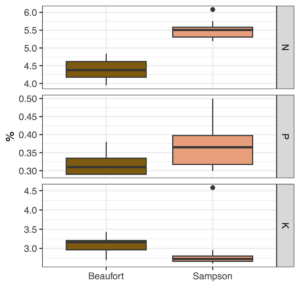
Figure 3. Box plots show the data distribution and median (black line) of leaf macronutrients (nitrogen-N, phosphorus-P, potassium-K) measured at soybean early developmental stage for Beaufort and Sampson counties.
Table 3. Leaf macronutrients (nitrogen-N, phosphorus-P, potassium-K) measured at soybean early developmental stage (approximately V4-V5) in the most recent mature leaves by NCDA&CS. Union samples were compromised due to heavy rain at collection date.
| Location | MG | Treatment | N (%) | P (%) | K (%) |
| Beaufort | 5.2 | EndoShield ST | 4.84 | 0.38 | 3.18 |
| Vault IP Plus | 4.18 | 0.29 | 3.17 | ||
| Stabilize RZ | 3.95 | 0.3 | 3.04 | ||
| Non-treated | 4.30 | 0.35 | 3.15 | ||
| 6.1 | EndoShield ST | 4.67 | 0.29 | 2.73 | |
| Vault IP Plus | 4.6 | 0.29 | 2.7 | ||
| Stabilize RZ | 4.17 | 0.32 | 3.43 | ||
| Non-treated | 4.45 | 0.33 | 3.28 | ||
| Sampson | 5.2 | EndoShield ST | 6.08 | 0.3 | 2.62 |
| Vault IP Plus | 5.75 | 0.42 | 2.75 | ||
| Stabilize RZ | 5.49 | 0.37 | 2.71 | ||
| Non-treated | 5.19 | 0.5 | 4.58 | ||
| 6.1 | EndoShield ST | 5.53 | 0.39 | 2.68 | |
| Vault IP Plus | 5.34 | 0.31 | 2.74 | ||
| Stabilize RZ | 5.52 | 0.36 | 2.61 | ||
| Non-treated | 5.21 | 0.32 | 2.96 |
Summary
- Soybean yield varies between locations. Within locations, yield differs between maturity groups. Yield patterns are consistent with NC State 2023 Soybean OVT yield comparisons.
- Microbial biostimulant seed treatments did not influence yield (or early development leaf nutrients). There was no difference in yield between microbial treatments and non-treated controls.
- Yield values within treatments (including non-treated controls) tend to have a large range or spread. For these small plot trials, a significant difference would require consistent and large increase in yield between treatment and control.
- Environmental variables between production environments drives differences in field performance and soybean yield. These variables may include weather, soil biogeochemistry, and differences in soil microbiome diversity.
Appendix
Supplementary Table 1. Soil chemical and physical characteristics at planting (data from NCDA&CS and NC State EATS Laboratory). Cultural practices and weather data from NC State OVT Soybean 2023 Supporting Data.
| Location | Beaufort | Sampson | Union |
| Soil Description | Organic | Loamy Sand | Silt Loam |
| Prior Crop | Wheat | Corn | Cotton |
| HM (%) | 8.24 | 2.68 | 0.41 |
| W/V (g/cm3) | 0.97 | 1.09 | 0.76 |
| CEC (meq/100 cm3) | 11.5 | 8.7 | 16.7 |
| BS (%) | 60 | 77 | 97 |
| Ac | 4.6 | 2.0 | 0.5 |
| pH | 5.0 | 5.8 | 7.2 |
| Na (mg/dm3) | 0 | 0 | 0.1 |
| P (mg/dm3) | 80 | 161 | 535 |
| K (mg/dm3) | 87 | 254 | 280 |
| Ca (mg/dm3) | 1093 | 932 | 2945 |
| Mg (mg/dm3) | 153 | 173 | 96 |
| S (mg/dm3) | 12 | 15 | 25 |
| Mn (mg/dm3) | 6.2 | 6.0 | 34.7 |
| Cu (mg/dm3) | 2.4 | 1.4 | 2.7 |
| Zn (mg/dm3) | 14.1 | 4.7 | 13.7 |
| Total C (%) | 7.77 | 2.95 | 4.05 |
| Total N (%) | 0.27 | 0.17 | 0.35 |
| Total Rainfall (in) | 20.98 | 22.8 | 17.12 |
| Ave High Temp (˚ F) | 81.0 | 82.3 | 82.8 |
| Planting Date | 5/12/2023 | 5/13/2023 | 5/10/2023 |
| Harvest Date | 11/8/2023 | 11/6/2023 | 10/25/2023 |
| Population | 190,000 | 145,000 | 145,000 |
Supplementary Figure 1. Full season weather data across locations. Data from NC State OVT Soybean 2023 Supporting Data.
Acknowledgements
Dr. Mallory Choudoir (Assistant Professor and Extension Specialist in the Department of Plant and Microbiology) conducted the study and analyzed all results. The NC State Official Variety Testing (OVT) program and Ryan Heiniger planted and harvested the trial. This work was funded by the North Carolina Soybean Producers Association.